
Topic 200: Capacity Planning
Kursvorgaben LPI:
Topic 200: Capacity Planning
200.1 Measure and Troubleshoot Resource Usage (weight: 6)
Candidates should be able to measure hardware resource and network bandwidth, identify and troubleshoot resource problems.
Key Knowledge Areas
- Measure CPU usage.
- Measure memory usage.
- Measure disk I/O.
- Measure network I/O.
- Measure firewalling and routing throughput.
- Map client bandwidth usage.
- Match / correlate system symptoms with likely problems.
- Estimate throughput and identify bottlenecks in a system including networking.
The following is a partial list of the used files, terms and utilities
- iostat
- erste zahl interval; zweite zahl wie oft (unendlich wenn fehlt)
- iotop
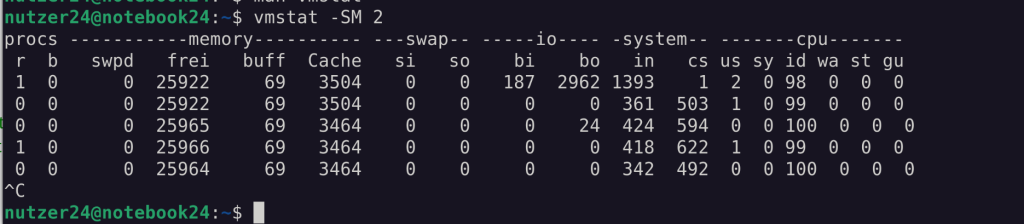
- vmstat
- vmstat -SM // macht es weniger kaput bei der anzeige
- netstat
- ss
- iptraf
- pstree, ps
- pstree -sup $$
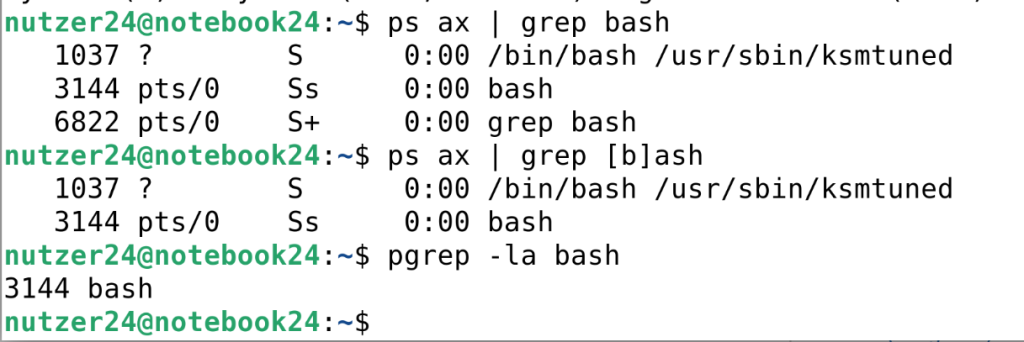
- pgrep und pkill << extra
- ps aux | grep [b]ash
- w
- lsof
- top
- 1, 5 und 15 min loads haben noch 1/2 von dem zeitraum davor, 1/4 von dem zeitraum noch davor
- htop
- uptime
- sar
- swap
- processes blocked on I/O
- blocks in
- blocks out
Beispiele
- ps auxww
- ps -efl
- lsof
- -i // welches program nutzt welche ports
- -Pni
- dadb
- -c $PROCESS // alle resources vom Process
- lsof -ac zebra -Pni
- a macht es erst sinnvol weil dann und verknüpftl
- -p für pid statt processname
- sysstat
- dpkg-reconfigure sysstat
- netstat / ss
- netstat -i // Interfaces
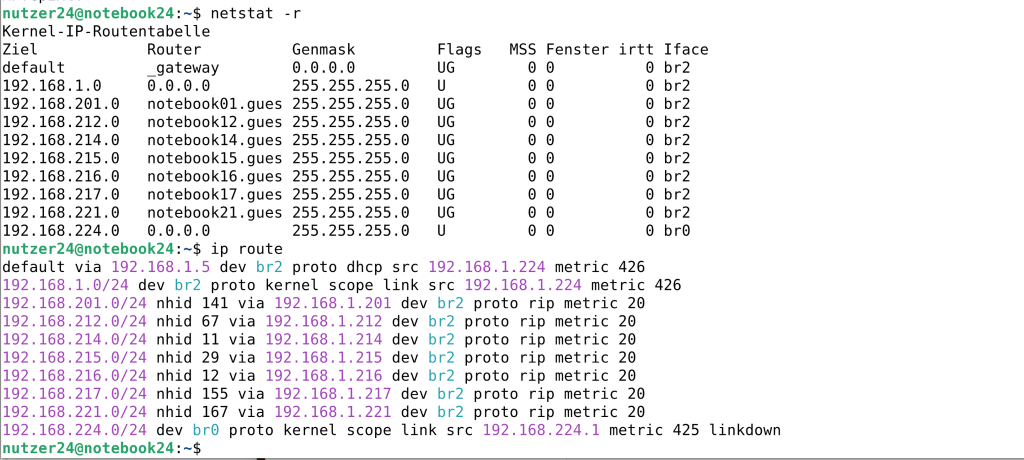
- netstat -r // Routes
- netstat -s // ip -s link show equivalent
- iotop
- iptraf
200.2 Predict Future Resource Needs (weight: 2)
Candidates should be able to monitor resource usage to predict future resource needs.
Key Knowledge Areas
- Use monitoring and measurement tools to monitor IT infrastructure usage.
- Predict capacity break point of a configuration.
- Observe growth rate of capacity usage.
- Graph the trend of capacity usage.
- Awareness of monitoring solutions such as Icinga2, Nagios, collectd, MRTG and Cacti
The following is a partial list of the used files, terms and utilities
- diagnose
- predict growth
- resource exhaustion
Beispiele
- collectd
200.1 Measure and Troubleshoot Resource Usage
netstat / ss
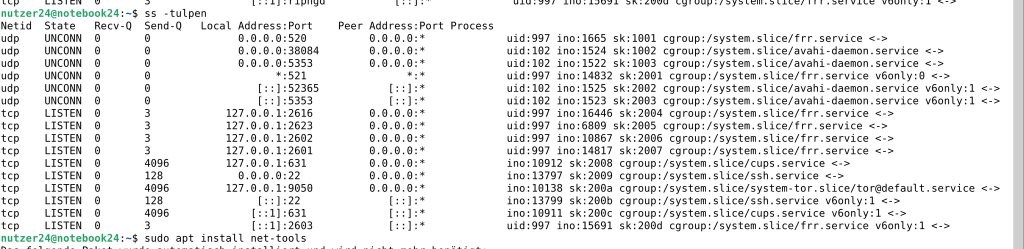
Anzeige aller Netzwerkverbindungen / In diesem Beispiel alle offenen TCP und UDP Verbindungen mit Prozessdetails
-t : TCP
-u : UDP
-l : Listening Connections
-p : Prozess Details
-e : Extended Info
-n : Numeric (Namen von Services und IPs nicht auflösen)
Netstat kann noch einige Dinge, die mittlerweile z.B. in “ip link” oder “ip route” ausgelagert sind.
lsof
lsof -i / -Pi / -Pni
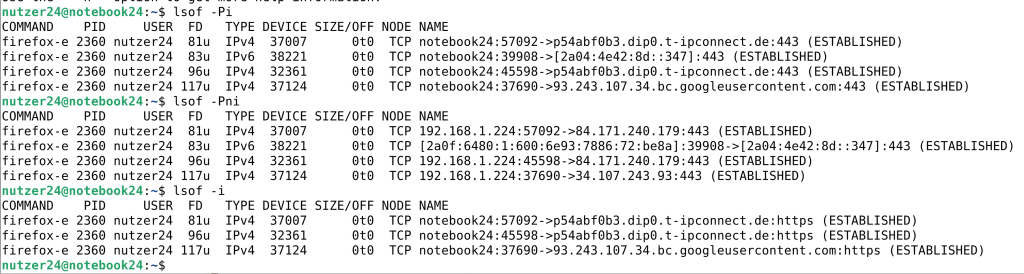
lsof kann keine Netwerk Ports anzeigen, die aus dem Kernel kommen. Also z.B. bei DRBD (Distributd Raid Block Device), da dieses Verbindungen, weil Block Device, aus dem Kernel kommen.
lsof -c (Command) um offene Files / Verbindungen zu einem Command / Prozess zu finden.
lsof verknüpft Filter im Standard mit “OR”. Darum muss man immer -a (z.B. -ac) angebene, um die Filter mit “AND” zu verknüpfen.
Offene Verbindungen eines Nutzers: lsof -u (bzw. -au)

ps / pstree
ps bildet beide Syntax Varianten ab BSD Unix und auch SysV Unix. Darum gibt es für eine Ausgabe meistens zwei verschiedene Parameter Sets, die das gleiche tun.BESCHREIBUNG
ps zeigt Informationen zu einer Auswahl aktiver Prozesse an. Falls Sie eine wiederholte Aktualisierung der Auswahl und der angezeigten Informationen
benötigen, verwenden Sie stattdessen top.
Diese Version von ps akzeptiert verschiedene Arten von Optionen:
1 UNIX-Optionen, die gruppiert sein können und denen ein Bindestrich vorangestellt werden darf.
2 BSD-Optionen, die gruppiert sein können und denen kein Bindestrich vorangestellt werden muss.
3 Lange GNU-Optionen, denen zwei Bindestriche vorangestellt werden müssen.
ps ax (Alle Prozesse, Extended) / ps -efl
ps aux (Alle Prozesse, User, Extended)
ps auxww (ww: Aktiviert die breite Ausgabe)
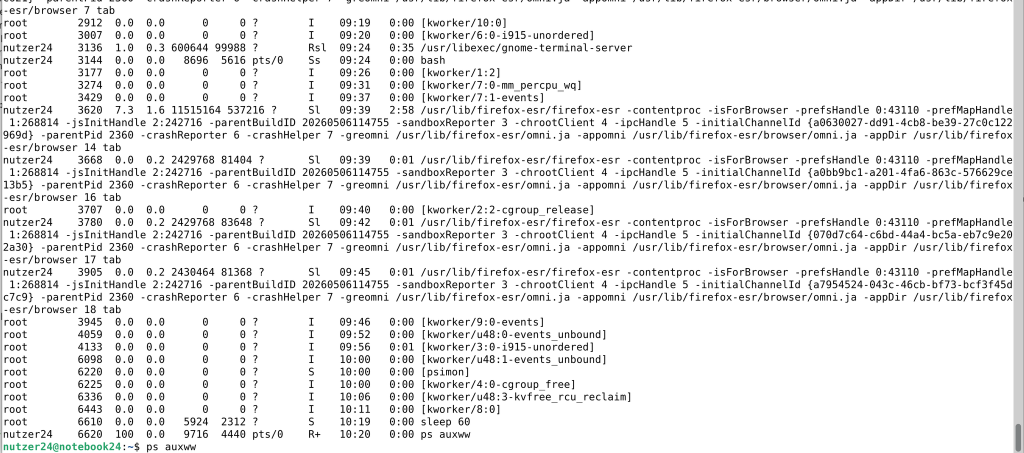
pstree um die Hierarchie eines Prozesses (in diesem Fall dem gerade ausgeführten) anzuzeigen, incl. aller Benutzerwechsel etc.

top
Status eines Prozesses:
i : internal Kernel thread (kein Prozess im eigentlichen Sinne)
r : running
s : sleep
d : uninterruptible sleep (z.B. waiting for I/O)
t : traced (gestoppt / kill -19)
z : zombie (kann nur über den Vater-Prozess gekillt werden / pstree)
Fact: Prozesse können keine Dateien öffnen. Prozesse können nur den Kernel fragen, Dateien für den Prozess zu öffnen.
iostat
Um iostat verwenden zu können, muss “sysstat” als Paket installiert sein.

Fact: %steal im iowait ist ein Wert, der für virtelle Maschinen relevant ist. Das ist quasi ein Äquivalten zu CPUready in vmware - nur aus der Sicht der VM gesehen. Hier sagt der Wert aus, dass die VM CPU Zyklen angefordert hat, der Hypervisor diese aber abgelehnt hat.
vmstat
Statistiken zu virtuellem Speicher.
Fact: Uptime zeigt auch die Load an 😀

200.2 Predict Future Resource Needs
Icinga2 ist ein Nagios Fork. Beides ist check basiertes Monitoring
MRTG ist ein eher alter Vertreter der Monitoring Welt, das RRD Grafiken zur Darstellung von Monitoring Werten verwendet.
collectd ist ein statistik “Sammeldienst”, auf den ich on top grafische Frontends hinzufügen kann.
Cacti ist auch ein rrd basiertes Tool
No comments to display
No comments to display